
Introduction
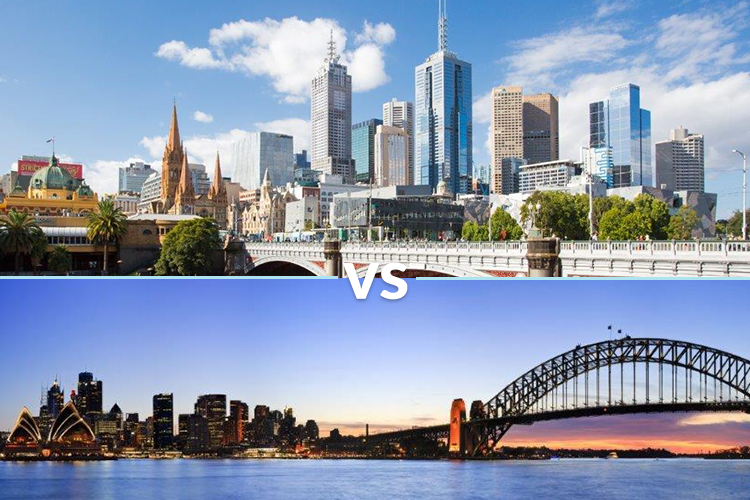
For many people, who is moving to Australia or planning to relocate with in Australia and looking for better life style, it is always a difficult task to chose the one from two of the best cities, not only in Australia but also in the world, Sydney and Melbourne. These two cities finds place in the List of Top 10 most livable cities in the World almost every year.
For the year ending 30 June 2019:
- There were over 7.5 million migrants living in Australia.
- 29.7% of Australia’s population were born overseas.
- Australia’s population increased by 239,600 people due to net overseas migration.
- 404,000 people moved interstate, an increase of 2.9% from the previous year.
Business problem
The objective of this project is to analyze and select the best city to live in Australia between Sydney and Melbourne.
This project is mainly focused on geospatial analysis of the cities Sydney and Melbourne to understand which would be the best place to migrate to/stay. Using data science methodology and machine learning techniques like clustering, this project aims to provide solutions to answer the business question: Between the cities Sydney and Melbourne, if some one looking to migrate, where would you recommend that they stay?
Data
To solve the problem, we will need the following data:
• List of neighborhoods/Suburbs in Sydney and Melbourne. This defines the scope of this project which is confined to the cities Sydney and Melbourne, two of the best cities in Australia.
• Latitude and longitude coordinates of those neighborhoods/Suburbs. This is required in order to plot the map and also to get the venue data.
• Venue data, particularly data related to top 10 venues in each neighborhood/Suburb . We will use this data to perform clustering on the neighbourhoods.
Sources of Data and methods to extract the Data
The below links from Australia Post website are used as data sources:
Used the web scraping techniques to extract the data from the Australia Post page, with the help of Python requests and Beautifulsoup packages. The latitude and longitude details of the neighborhoods using Geocoder package. After that Foursquare API is used to get the venue data for those neighborhoods.
Foursquare API will provide many categories of the venue data, and we are particularly interested in the top 10 venues in order to help us solve the business problem. This is a project that will make use of many data science skills, from web scraping (Australia Post website), working with API (Foursquare), data cleaning, data wrangling, to machine learning (K-means clustering) and map visualization (Folium).
Methodology
The Foursquare API allows application developers to interact with the Foursquare platform. The API itself is a RESTful set of addresses to which you can send requests, so there’s really nothing to download onto your server.
Food in Melbourne

Food returned by Foursquare

On the left, you see all the restaurants and their name, category, address of venues in Melbourne. On the right, you see the map of the venues on the left.
Exploring the results

If you click on any of the result, then you are redirected to the page where you see all the information in the Foursquare dataset about That place (here Roule Galette). This includes its name, full address, working hours, tips and images that users have posted about the cafe. So similarly you can explore the other venues of interest in Sydney and Melbourne cities.
To explore the Foursquare click here.
Download/Import required Libraries
First we need to install or import all the required libraries.

Web Scraping
Perform scraping using Python requests and beautiful soup packages to extract the list of neighborhoods data.
- Send the GET request data.
- Parse the data from html into a beautiful soup object soup.
- Create a list to store Suburbs and Postal Codes.
- Append the data into the lists.
- Create a new Data Frames from the lists.
- Remove any records with duplicate postal codes.


The Data Frames are created after scraping the data. We need to get the geographical coordinates in the form of latitude and longitude in order to be able to use Foursquare API. To do so, we will use the Geocoder package that will allow us to convert the address into geographical coordinates in the form of latitude and longitude.
- Defining a function to get coordinates.
- Initialize empty Data Frame.
- Loop until you get the coordinates.
- Print the Data Frame.
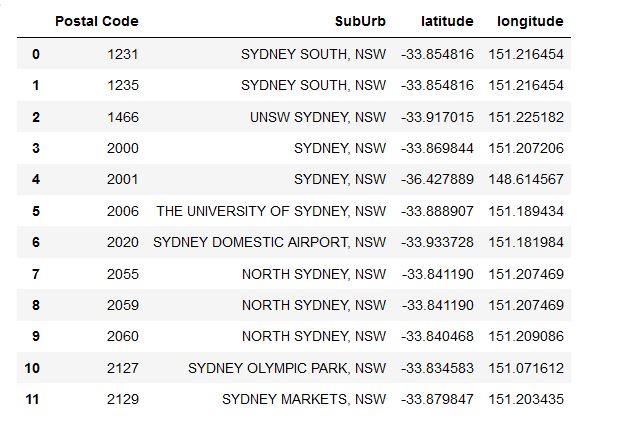

We have obtained the latitude and longitude coordinates for all the places.
After gathering the data, we have to visualize the neighborhoods in a map using Folium package.


Use the foursquare API to explore the neighborhoods
- Provide Client ID and Client Secret details.
- Get the results in Json file using the dynamic URLs for each Suburb.
- Convert the results into Data Frame.
- Using the onehot coding and group by identify the count of each venue for all the locations.
- Create Data frame with top 10 venue details for each Suburb.


Clustering the neighborhoods
Now we need to cluster all the neighborhoods into different clusters. The results will allow us to identify which city is surrounded by diverse group of clusters based on which our conclusion is drawn. If one city has less diverse clusters surrounding than the other help us answer the question that is which city is better place for living.
We set the number of clusters to 4 and run the algorithm. After applying the K-Means clustering algorithm, all the neighborhoods/suburbs get segregated and form different clusters based on the top 10 venues in that area.


Visualizing the resulting clusters
Both the cities marked in boxes.


Conclusions
Up on examining the results (final maps with clusters), it is clear that the city of Melbourne is surrounded by diverse group of clusters in close proximity where as for city of Sydney, the clusters are spread out far. Also the clusters represented with Yellow color are very far from the city of Sydney.
As these clusters intern represent group of venues, we are making an assumption that Melbourne has access to variety of venues compared to Sydney. This will impact the quality of living.
So with this analysis we are placing Melbourne on top of the Sydney in terms of place for quality of living.
By factoring the other aspects such as population growth, health facilities, education facilities and other venues etc this analysis can be further verified and finding can be very different from what we have here. Given all these are currently not in scope, and with the tools and understanding we have, we hope this analysis and findings are justifies well enough.
Hope you found the article helpful.
Thank you so much for reading !

You must be logged in to post a comment.